A JavaFX Christmas Demo
Another Christmas will be here soon and it promises to be a good one
I received my Christmas present early when JavaFX and the Consumer JRE (now Java SE 6 Update N) were announced in May. I immediately joined the new JavaFX tools team and started hacking on our new designer tool. The new tool is proceeding smoothly and I can't wait for the day we unveil it; but today is not that day, nor any other day soon (sorry guys!). However, I'm also spending some of my time learning JavaFX Script and working on new demos. So here is my new Christmas demo, which I hope to make an annual occurrence.
 Santa Stats: click to launch
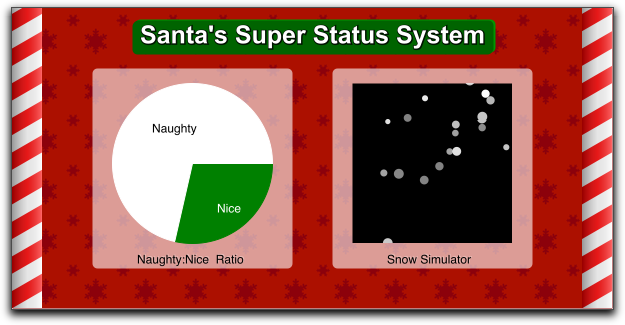
The concept of this demo is that Santa needs software too. But of course his software would be beautifully built by master elfin interaction designers. This demo has two components. The clickable pie chart indicates the breakdown of children into naughty and nice, as well as showing the breakdown into sub-categories like bad, evil, and malevolent. The second demo is a snow simulator (click on the black area to make it start). I imagine that this is the streamlined version Santa has on his laptop. The master control center would probably have hundreds of widgets like these to measure everything from monthly toy production to maple syrup viscosity and candy cane accretion levels.
The Piechart
This is my first attempt at building reusable components entirely in JavaFX Script. The pie chart is nice because you can simply insert some value objects and it will do the plotting for you. If you click on a pie piece the chart will do a nice transition into a breakdown of that section. I plan to do some more work on the title positioning (it's manual now), but this proves JavaFX Script can be used in more business-like settings. Perhaps this chart is useful enough to put in some sort of community driven component library.
Here's the code which sets up the pie chart you see in the screenshot above.
var chart = PieChart {
    size: 160,
    backgroundColor: rgba(255,0,0,0),
    transform: translate(20,15),
    values : [
    ChartValue { title: "Naughty", value: 50, color: white, x: 40, y: 40, textColor: black ,
        breakdown : [
            ChartValue { value: 20, color: red, title: "Evil", x: 120, y: 60, textColor: white },
            ChartValue { value: 50, color: green, title: "Bad", x: 35, y: 25, textColor: white },
            ChartValue { value: 50, color: white, title: "Malevolent", x: 60, y: 120, textColor: black }
        ]},
    ChartValue { title: "Nice", value: 20, color: green, x: 105, y: 120, textColor: white,
        breakdown: [
            ChartValue { value: 20, color: white, title: "Angels", x: 85, y: 40, textColor: black },
            ChartValue { value: 50, color: green, title: "Not yet bad", x: 35, y: 100, textColor: white },
        ]}
]};

chart.rebuildChart();
The Snow Simulator
The other component is the Snow Simulator. I think the motion effects turned out well, but the simulation is very heavy on the CPU. I suspect I'm not using a terribly efficient algorithm. That's another thing I will have to revisit.
Everything else in this demo is very straight forward code you've seen before. The candy canes are a reusable class similar to the StripePainter from SwingX, combined with a subtle gradient for the shading effect and a clip rect. All text and backgrounds are created with translucent rectangles and layered text. You can download the entire NetBeans project here.
Learning Experiences
One thing I've noticed when building my demos is my development style. It's totally different than when writing Java programs. When I code Java, I think first about the objects and interfaces, create empty .java files, and then start writing the implementation. When I write JavaFX script using the preview mode in NetBeans my style is completely different. I immediately start throwing up shapes and UI components, constantly moving code around and renaming things. Once I have something solid only then do I split it into separate classes. It's definitely a less rigorous but more fluid development experience. And, dare I say it, more fun!
So that's it for this year. I can't wait to see you in 2008 when we will ship the new Java 6 update, see the first release of the new Scene Graph, and of course give you your first peek at the designer tool.
Merry Christmas everyone!
Posted December 22nd, 2007
Tagged: java.net