How Bezier Curves Work
Today we are going to take a break from creative procedural generation and talk about a very useful graphics primitive, the Bézier curve, and learn how to render it from scratch.
One of the (too) many open source projects I run is called PureImage. It's a NodeJS module that implements the HTML Canvas 2D API in pure JavaScript. I created it because I needed a highly portable implementation. Most Canvas libs for Node are wrappers around a heavy native library like Skia or GTK. If you don't care about speed but do care about ease of installation and portability, then PureImage is the library for you.
The Canvas 2D API is heavily based on the Postscript imaging model, meaning everything is rendered as filled or stroked curves, back to front. Having a good curve implementation is crucial. The one currently in PureImage works well enough, but it has a few flaws. That's what we are going to address today.
Cubic Curve Primitives
If you want to draw any sort of polygon you can use the line as your primitive. A rectangle is just four lines drawn end to end. Similarly, curved shapes need a curve primitive. In most graphics APIs this primitive is the cubic curve, also called the Bézier curve after the guy who discovered some neat ways to work with them. Yes I know I'm simplifying the definition here and leaving out higher order curves and bernstein polynomials, but for our purposes we can just focus on cubics
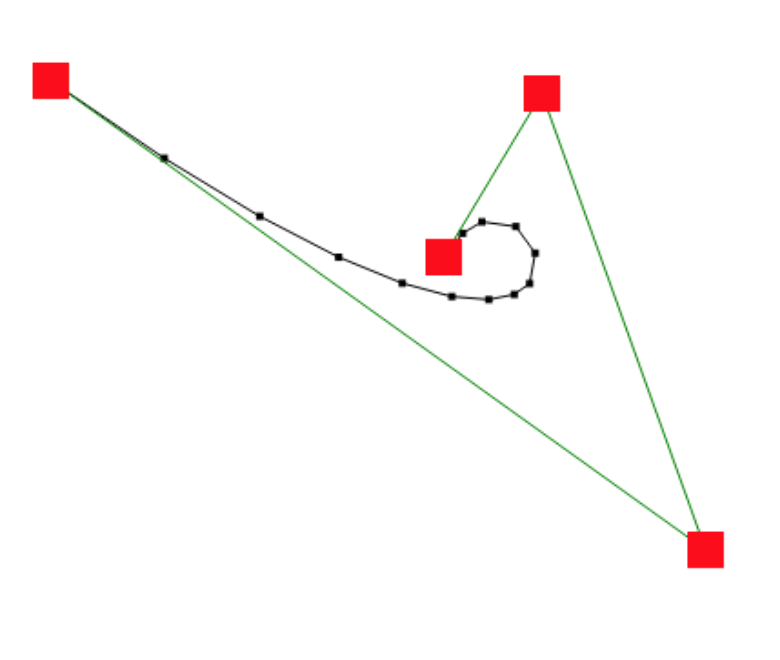
If you've every used Adobe Illustrator or another vector graphics program you've probably seen the path/pen tool. You can make any sort of curved shape you want using a series of points with little handles on them like this:
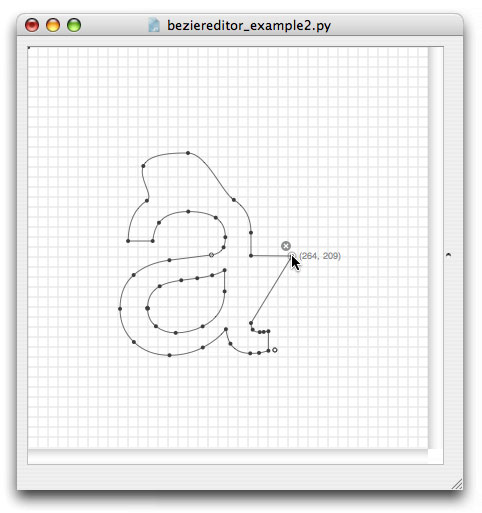
Each segment of this complex curve is called a Bézier curve. By combining multiple curves together you can create any shape you want. The Bézier curve is the fundamental primitive of curved shapes.
The Bézier curve is also called a cubic because it can be defined by a cubic polynomial like this:

Being defined as a polynomial means we can do interesting things with it, like evaluate the equation at any point we want, then make objects move along the point. This is commonly done in 2D and 3D animation.
How do we draw a line?
Most graphics APIs have cubic curve support built in. Canvas has a bezierCurveTo function which takes the end and control points as arguments. However, since we want to implement canvas ourselves (for PureImage) the question becomes: How do we draw a curve from scratch with just a pixel buffer?
Let's consider the straight line. To draw a line there are existing algorithms like Bresenham's that draw a line with precise pixels. It starts at one end and steps along the line, filling in the exact pixels needed. There are similar algorithms for circles and ellipses.

It turns out there is no exact algorithm to draw just the pixels underneath a cubic curve. However, it is quite easy to calculate the XY position of a point on the curve using a t value of the parametric equation. A parametric equation is an equation where you give it a single input value, usually called t, which then produces an XY value for a point. Again, the real definition of a parametric equation is more complicated, but this will suffice for our purposes. If we evaluate the equation with t going from 0 to 1 in small increments then we will get points for the entire curve. This is called subdivision.
Uniform Subdivision
This is the code to get an XY point at a particular value of T
//javascript code to evaluate a bezier curve at a T value
function calcBezierAtT (p, t) {
    const x = (1-t)*(1-t)*(1-t)*p[0].x
          + 3*(1-t)*(1-t)*t*p[1].x
          + 3*(1-t)*t*t*p[2].x
          + t*t*t*p[3].x;
    const y = (1-t)*(1-t)*(1-t)*p[0].y
          + 3*(1-t)*(1-t)*t*p[1].y
          + 3*(1-t)*t*t*p[2].y
          + t*t*t*p[3].y;
    return {x, y}
}
We still don't have a way to draw the curve directly, but we can simply connect the points with lines. This is easy because we already know how to draw lines. Now we just need to increment for the T value like this:
function drawCurve(curve,color) {
let prev = calcBezierAtT(curve, 0)
for (let t = 0; t <= 1.0; t += 0.1) {
const curr = calcBezierAtT(curve, t)
drawPoint(curr)
drawLine(prev, curr, color)
prev = curr
}
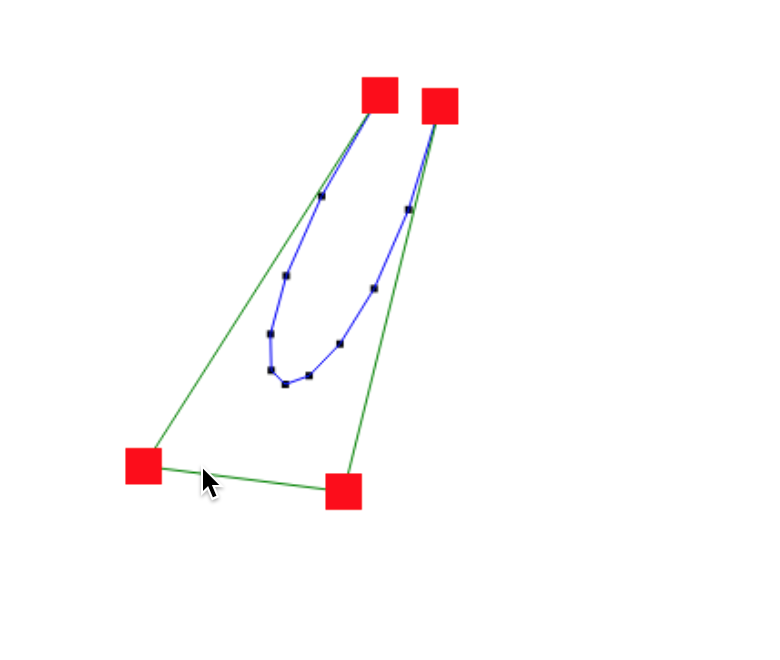
}If we choose an increment of 0.1 then we get ten points resulting in this curve.
Not bad. Let's try 100 points using 0.01.
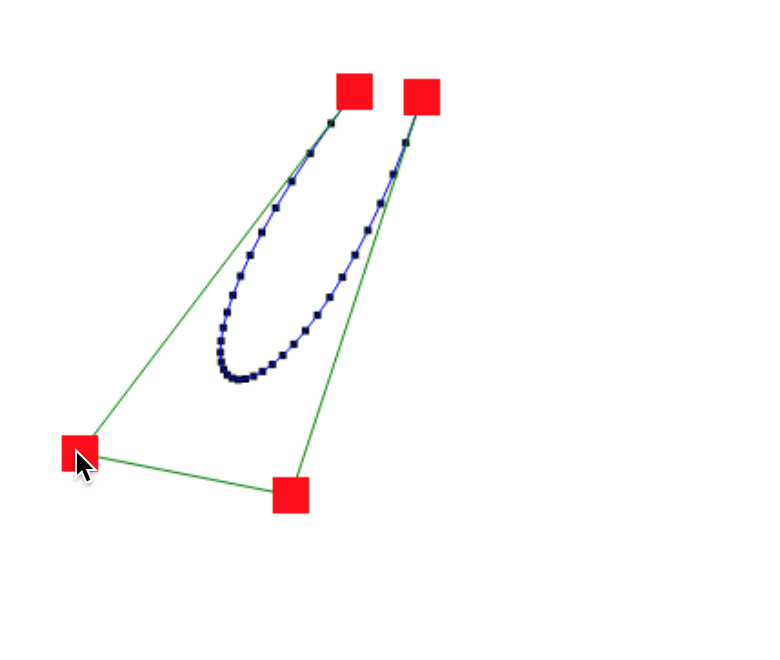
Much better. Notice how the curve looks smoother. However we still may have some flat parts in the portion of the curve with extreme angles and we have more points than needed in the flatter parts. It would be better if we had a smart way to pick the points instead of a uniform increment. Then we could have fewer points in the straight parts and more points in the curvier parts.
It turns out this is pretty easy to do thanks to some other interesting properties of the Bézier curve.
Splitting Curves
As we talked about before, a single curve segment is defined by both the end points and the control points. It turns out that any Bézier curve can be split into two smaller sub-curves that are still proper Bézier curves and perfectly line up with the original curve. Furthermore this splitting process is easy to calculate. This suggests an idea:
What if we split the curve into pieces, then split those pieces into more pieces, then eventually we would reach the point where each curve segment is flat enough to be drawn with a line, right?
In pseudo code it looks like something like this.
// pseudo-code
function recurse(curve) {
  if(curve flatEnough) {
	return curve
  } else {
	return recurse(splitLeft(curve))
	     + recurse(splitRight(curve))
  }
}
Splitting a curve at a T value is pretty easy. Check out this diagram.
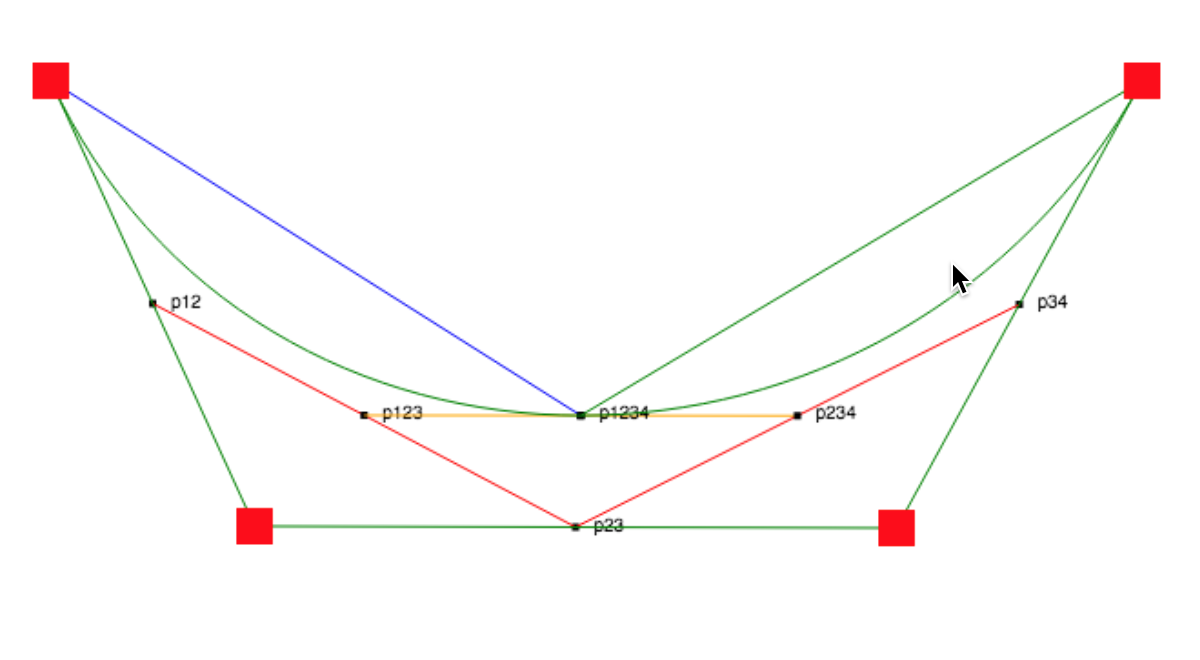
See how the midpoint of each line segment between the control points can be connected then connected again to form new control points. By calculating these midpoints we can create two new curves. In Javascript the code looks like this:
//code to split a bezier curve
function splitCurveAtT(p,t, debug) {
    let p1 = p[0]
    let p2 = p[1]
    let p3 = p[2]
    let p4 = p[3]
    let p12 = midpoint(p1,p2,t)
    let p23 = midpoint(p2,p3,t)
    let p34 = midpoint(p4,p3,t)
    let p123 = midpoint(p12,p23,t)
    let p234 = midpoint(p23, p34,t)
    let p1234 = { x: (p234.x-p123.x)*t+p123.x,
                  y: (p234.y-p123.y)*t+p123.y}
    return [[p1, p12, p123, p1234],[p1234,p234,p34,p4]]
}
function midpoint(p1,p2,t) {
    return { x: (p2.x-p1.x)*t+p1.x, y: (p2.y-p1.y)*t+p1.y}
}
Calculating Curve Flatness
Now we just need a definition of what is flat enough to turn a curve into a line. There are many heuristics for how flat a curve is but we don't need to reinvent the wheel here. An algorithm invented by Roger Willcocks and elaborated in the paper Piecewise Linear Approximation of Bézier Curves by Kaspar Fischer gives us a simple function which takes a curve and gives us a flatness value. Then we just decide if the flatness is below a some threshold value then it's flat enough.
Here's the code:
function flatness(curve) {
    const p1 = curve[0]
    const cp1 = curve[1]
    const cp2 = curve[2]
    const p2 = curve[3]
    let ux = Math.pow( 3 * cp1.x - 2 * p1.x - p2.x, 2 );
    let uy = Math.pow( 3 * cp1.y - 2 * p1.y - p2.y, 2 );
    let vx = Math.pow( 3 * cp2.x - 2 * p2.x - p1.x, 2 );
    let vy = Math.pow( 3 * cp2.y - 2 * p2.y - p1.y, 2 );
    if( ux < vx )  ux = vx;
    if( uy < vy )  uy = vy;
    return ux + uy;
}
The final recursive Javascript code looks like this:
function recurse(curve) {
    if(flatness(curve) < THRESHOLD) {
        return drawLine(curve[0],curve[3])
    } else {
        const split = splitCurveAtT(curve,0.5,false)
        recurse(split[0])
        recurse(split[1])
    }
}
And results in a pretty line like this:
See how there are more points in the tight cusp of the curve and less points in the flat part. That's the magic of adaptive subdivision. For this image I used a threshold of 100 so you could better see the points. In practice I use the much smaller threshold of 1, resulting in more points. The exact threshold you should use depends on what you are using this algorithm for.
Using Curves for Procedural Generation
Much like how the line is a primitive that can be manipulated in procedurally generated artwork, we can also use the Bézier curve. Since we can now control exactly how our curves are drawn, we can do interesting things like turn a complex curve into lines that still leave some of the angularness, or randomly perturb the control points to get crazy distorted versions of common shapes.
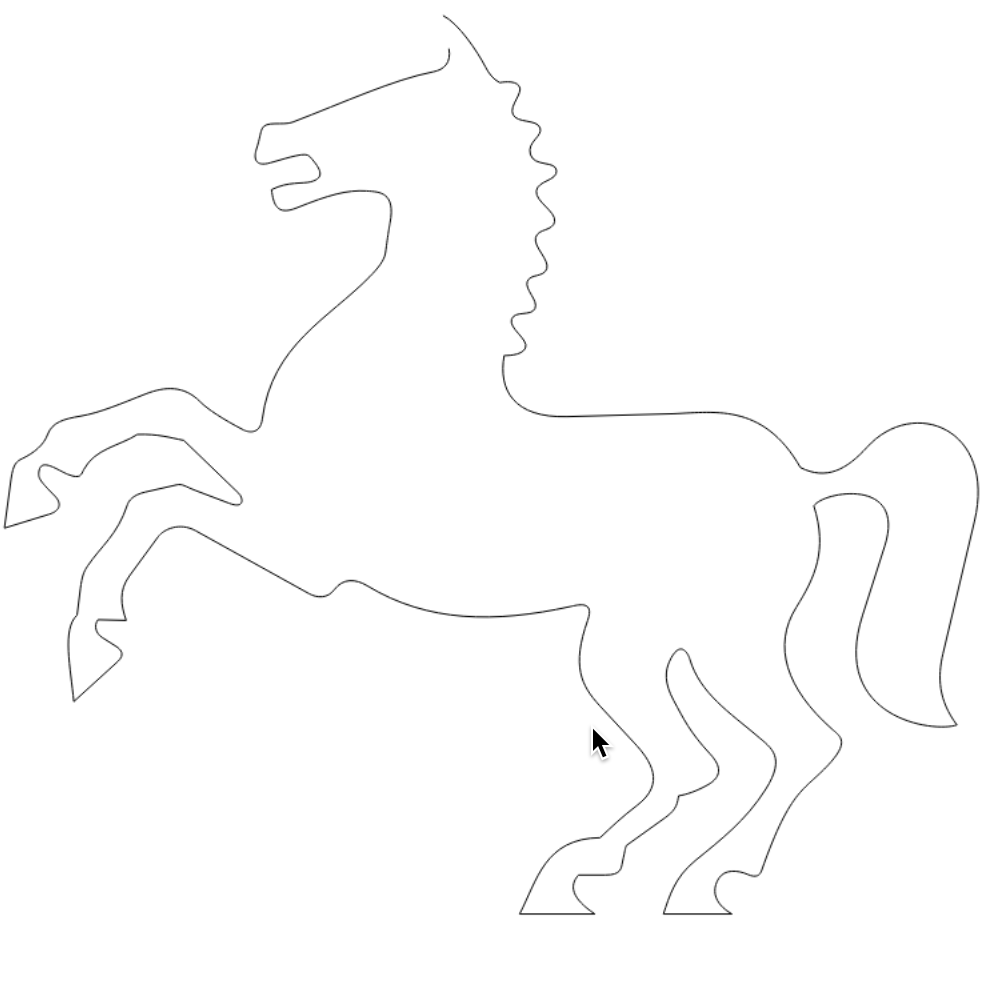
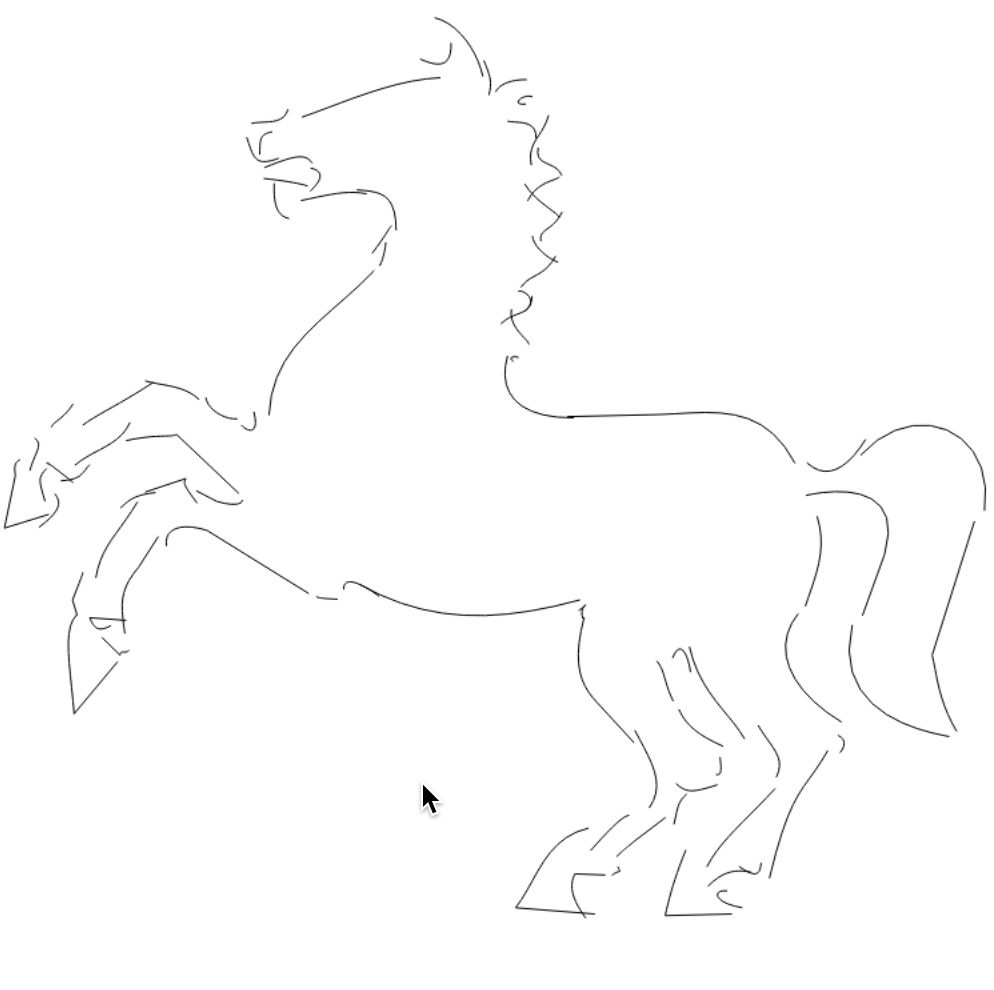
Here are a few experiments of my own using this diagram of a horse at OpenClipArt.org
The original horse shape:
Render all curves as straight lines:
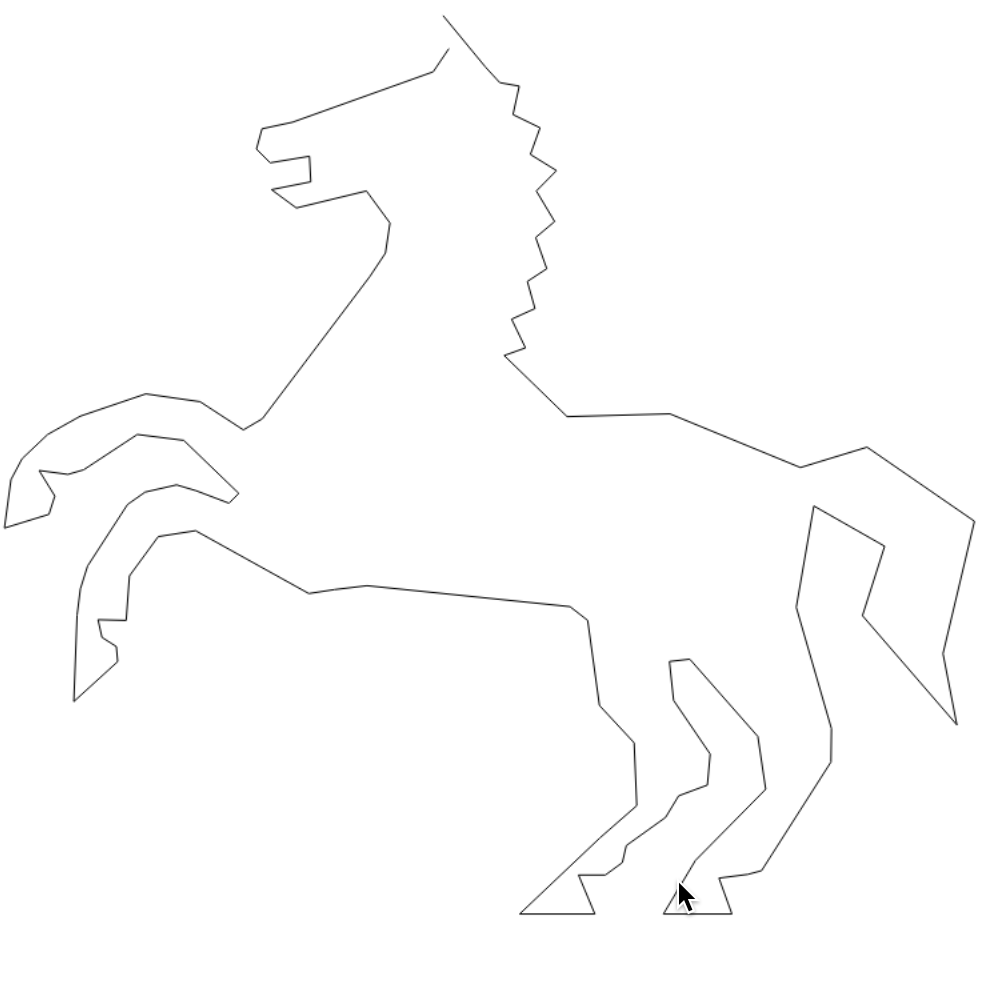
Snap the end points of curves to a 10x10 pixel grid:
Randomly perturb the control points but not the end points
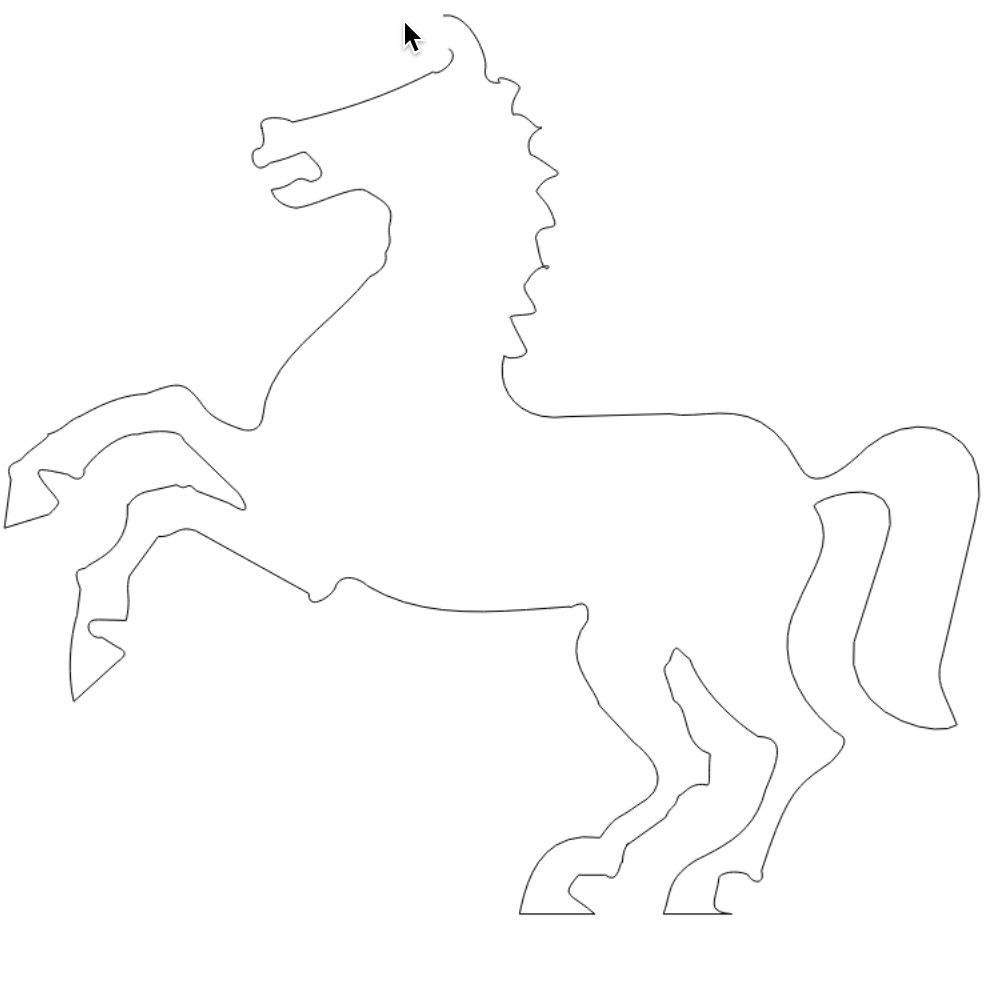
Randomly perturb the end points but not the control points:
Thank You For Reading
Much as a painter needs to be familiar with how color works, generative artists should be familiar with how the different graphics primitives work. I hope this article gives you a deeper understanding of Bézier curves and how they can be rendered and manipulated.
If you are interested in procedural generation, read the whole series here.
Posted July 11th, 2018
Tagged: javascript graphics procgen